Category:English-language biological diagrams
Jump to navigation
Jump to search
Media in category "English-language biological diagrams"
The following 141 files are in this category, out of 141 total.
-
06 07 life cycle, Mucor sp., Mucorales, Zygomycota (M. Piepenbring).svg 2,200 × 1,650; 709 KB
-
09 10PyruvateToAcetylCoA-L.jpg 1,402 × 777; 131 KB
-
3882929 orig.png 1,100 × 506; 136 KB
-
404 Goblet Cell new.jpg 2,539 × 4,722; 1.26 MB
-
Fed-batch principle.pdf 1,620 × 1,093; 151 KB
-
A very basic schematic of Notch signaling.png 400 × 400; 34 KB
-
AA hierarchy.svg 562 × 469; 22 KB
-
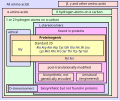
Aa structure function (2).svg 284 × 308; 753 bytes
-
Aa structure function.svg 286 × 312; 5 KB
-
ABC Model dutch txt.svg 936 × 715; 46 KB
-
ABC Model.svg 936 × 715; 39 KB
-
ABDOMEN (PSF).png 1,673 × 1,445; 223 KB
-
Actie Site of Eflornithine.png 494 × 515; 223 KB
-
Adipos-iWatCellNumber.jpg 531 × 396; 33 KB
-
Aggregated distribution of parasites on hosts.svg 1,135 × 936; 17 KB
-
Aging treatment approaches.jpg 1,167 × 426; 33 KB
-
Aging treatment approaches.svg 1,459 × 533; 139 KB
-
Alteracions al gen NR3C1.jpg 548 × 395; 25 KB
-
Alternatives to Darwinism.png 960 × 720; 89 KB
-
Alternatives to Darwinism.svg 1,052 × 744; 56 KB
-
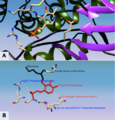
An ecological study of prairie and forest invertebrates (1915) (20522844734).jpg 2,544 × 1,774; 573 KB
-
Autophagy-conjugation.gif 620 × 325; 30 KB
-
B. anthracis Macrophage Invasion Mechanism.jpg 1,856 × 1,012; 167 KB
-
Baculovirus y el gusano de la seda.png 1,193 × 661; 211 KB
-
Basic moth identification features.jpg 1,326 × 1,599; 193 KB
-
Bio Film Image 1.JPG 600 × 300; 14 KB
-
Bio Film Image 2.JPG 600 × 431; 26 KB
-
Density gradient.JPG 720 × 475; 32 KB
-
Diagram of a Flower.svg 512 × 293; 311 KB
-
Differences between simple animal and plant cells (en).svg 512 × 253; 7 KB
-
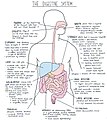
Digestive System Diagram.jpg 1,500 × 1,682; 569 KB
-
Dopamine and serotonin pathways.png 720 × 480; 55 KB
-
Dopamine pathways.svg 479 × 335; 27 KB
-
DPI Silicon Neuron.jpg 416 × 532; 104 KB
-
Dycotyledon seed diagram-en.svg 617 × 591; 35 KB
-
Embryo (PSF).png 2,082 × 1,433; 234 KB
-
Etv6 tm1a(KOMP)Wtsi.jpg 1,190 × 153; 95 KB
-
Fed-batch principle.svg 1,038 × 701; 305 KB
-
Gas exchange in the aveolus simple (en)-mr.svg 512 × 351; 7 KB
-
Gas exchange in the aveolus simple (en).svg 512 × 351; 3 KB
-
Gas exchange in the aveolus simple (gu).svg 447 × 337; 9 KB
-
Gas exchange in the aveolus simple-te.svg 512 × 351; 6 KB
-
Gehirn, medial - Lobi en.svg 724 × 482; 120 KB
-
Gehirn, medial - Lobi es.svg 724 × 482; 55 KB
-
Gene-environment interplay flow chart.jpg 6,294 × 1,589; 496 KB
-
Gene-environment interplay graph.png 1,723 × 435; 32 KB
-
Gilbertian Mimicry.svg 960 × 720; 15 KB
-
Glutamate reuptake via EAAT2 (GLT1).jpg 368 × 166; 29 KB
-
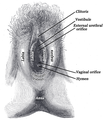
Gray1229.png 429 × 500; 225 KB
-
Hand drawn sodium-potassium pump and ion channels..png 1,379 × 1,372; 400 KB
-
Main-qimg-4dcc6bb4b8811aa0357e1b4bec57ad86.png 219 × 191; 48 KB
-
Melanosome distribution in keratinocytes in different skin types.png 1,324 × 867; 532 KB
-
NPS sequoia-general-sherman-tree-infographic.jpg 3,228 × 2,024; 700 KB
-
Nuclear Receptor Structure.png 2,999 × 2,249; 1.01 MB
-
Nucleosome organization.png 440 × 460; 77 KB
-
Oie hEzAtI2EU8ND.jpg 454 × 311; 22 KB
-
Oral mucosa.png 3,080 × 3,096; 15.73 MB
-
Orange cross section description.png 699 × 718; 662 KB
-
Original Antigenic Sin.svg 2,128 × 1,235; 23 KB
-
Osmoseragulation Carangoides bartholomaei bw en.png 1,000 × 600; 157 KB
-
Osmoseragulation Carangoides bartholomaei bw en2.png 1,000 × 600; 220 KB
-
Ovipositor (PSF).png 1,970 × 1,216; 126 KB
-
Parasitism in Gypsy moths.png 1,000 × 842; 228 KB
-
Patagium-flying squirrel-psf.png 1,944 × 1,520; 395 KB
-
Pathways.png 203 × 177; 23 KB
-
Pedicel (PSF).png 2,240 × 1,528; 280 KB
-
Perineuronal nets and chondroitinase ABC.png 662 × 727; 54 KB
-
Perineuronal nets.png 696 × 755; 70 KB
-
Petiole 2 (PSF).png 882 × 875; 88 KB
-
Phage display cycle.png 636 × 514; 150 KB
-
Phagocytosis -- amoeba.jpg 1,394 × 1,000; 231 KB
-
Phagocytosis in three steps.png 507 × 419; 53 KB
-
Phagocytosis2.png 932 × 655; 101 KB
-
PhenotypeNIH.gif 501 × 252; 35 KB
-
Phospholipids aqueous solution structures-2.png 331 × 407; 132 KB
-
Plant seed (PSF).png 921 × 1,538; 90 KB
-
Potato Beetle (PSF).png 1,615 × 1,601; 187 KB
-
PPAR-diagram.png 3,448 × 2,032; 2.72 MB
-
Protostomes.png 1,976 × 928; 487 KB
-
Protostomia.png 1,923 × 893; 582 KB
-
Pteridophyte lifecycle.jpg 1,252 × 1,024; 192 KB
-
Pterosaur Wing Anatomy.png 3,509 × 2,632; 9.56 MB
-
Q-cycle cytochrome b6f.png 2,337 × 1,544; 195 KB
-
Q-FISH workflow.png 1,429 × 1,107; 325 KB
-
Rachmuth Ca circuit.jpg 1,280 × 358; 111 KB
-
Receptors MV.tif 960 × 720; 132 KB
-
Red Snapper Length vs Age.png 800 × 600; 14 KB
-
Replication cycle of viruses of genus Flavivirus.jpg 1,440 × 1,803; 271 KB
-
Resident-cells-ct.jpg 2,999 × 2,249; 315 KB
-
RNA Seq Experiment.png 834 × 690; 58 KB
-
RNASeqPics1.jpg 720 × 540; 46 KB
-
RNASeqPics2.jpg 720 × 540; 33 KB
-
Rod.jpg 326 × 382; 33 KB
-
Rooster 1 (PSF).png 2,525 × 3,034; 323 KB
-
Schematic illustration of melanocyte structure.png 850 × 781; 196 KB
-
Schematic-of-Arabidopsis-thaliana-nectarium.jpg 600 × 285; 45 KB
-
Scheme flea anatomy-en.png 366 × 319; 34 KB
-
Selectionbig.jpg 610 × 446; 38 KB
-
Sendai virus life cycle for Wiki 2.tif 960 × 720; 371 KB
-
Sendai virus virion structure for Wikipedia3.tif 960 × 720; 427 KB
-
SensoryProcessing.png 690 × 149; 16 KB
-
Shkzf.jpg 750 × 486; 62 KB
-
Simple diagram of animal cell (en).svg 512 × 393; 2 KB
-
Simple diagram of bacterium (en).svg 703 × 623; 11 KB
-
Simple diagram of plant cell (en).svg 512 × 377; 4 KB
-
Simple diagram of virus (en).svg 709 × 531; 3 KB
-
Simple diagram of yeast cell (en).svg 512 × 382; 3 KB
-
SiRNA and RNAI english.png 1,039 × 903; 51 KB
-
SiRNA english.png 949 × 216; 6 KB
-
SiRNA mechanism.pdf 1,500 × 1,125; 669 KB
-
SiRNA mechanism.svg 960 × 720; 915 KB
-
Skinner box scheme 01.png 505 × 509; 68 KB
-
Soil Plant Air Continuum.png 417 × 346; 31 KB
-
Spadix (PSF).png 1,172 × 825; 82 KB
-
Sphingolipids1.jpg 1,024 × 362; 90 KB
-
Sphingolipids2.jpg 1,024 × 352; 126 KB
-
Sphk1 diag b.jpg 905 × 489; 82 KB
-
Spike frequency adapation.jpg 490 × 798; 133 KB
-
Stipule (PSF).png 1,480 × 1,303; 339 KB
-
Stomach mucosal layer english labels.svg 510 × 388; 641 KB
-
Structure of the reovirus virion.png 485 × 329; 26 KB
-
Summary of leading hypotheses of molluscan phylogeny.png 1,686 × 504; 561 KB
-
Symplastic and apoplastic water flow through root.png 1,502 × 1,062; 142 KB
-
T-Dependent B Cell Activation.png 4,020 × 3,143; 1.24 MB
-
TAAR1 Amphetamine Dopamine.png 807 × 1,024; 188 KB
-
TALEN copy.pdf 2,133 × 1,600; 1.27 MB
-
TALEN.png 862 × 647; 95 KB
-
The Giant Tube Worm, Riftia pachyptila and its Trophosome.png 800 × 598; 428 KB
-
Thigh (PSF).png 1,396 × 1,707; 144 KB
-
Toothed Whale Echolocation.png 1,817 × 1,164; 575 KB
-
Tylosaurus gut contents (SDSM 10439).svg 1,255 × 1,689; 1.5 MB
-
Types of endolithic organisms in relation to a hard rocky substrate.png 1,487 × 823; 1.03 MB
-
Types of tissues in bone.png 726 × 651; 223 KB
-
Various AMPs.png 845 × 654; 164 KB
-
Venn diagram example.png 676 × 545; 106 KB
-
Virus tegument.JPG 317 × 184; 20 KB
-
WalksTree.pdf 1,500 × 1,125; 721 KB
-
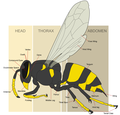
Wasp morphology.png 1,900 × 1,820; 468 KB
-
Wattle 2 (PSF).png 1,730 × 1,518; 96 KB
.png/120px-03_04_06_life_cycle_of_Puccinia_graminis_on_a_grass%2C_Pucciniales_Basidiomycota_(M._Piepenbring).png)
.svg/120px-06_07_life_cycle%2C_Mucor_sp.%2C_Mucorales%2C_Zygomycota_(M._Piepenbring).svg.png)


.svg/111px-Aa_structure_function_(2).svg.png)


.png/120px-ABDOMEN_(PSF).png)


_(20522844734).jpg/120px-An_ecological_study_of_prairie_and_forest_invertebrates_(1915)_(20522844734).jpg)


.svg/120px-Differences_between_simple_animal_and_plant_cells_(en).svg.png)


.png/120px-Embryo_(PSF).png)

-mr.svg/120px-Gas_exchange_in_the_aveolus_simple_(en)-mr.svg.png)
.svg/120px-Gas_exchange_in_the_aveolus_simple_(en).svg.png)
.svg/120px-Gas_exchange_in_the_aveolus_simple_(gu).svg.png)


.jpg/120px-Glutamate_reuptake_via_EAAT2_(GLT1).jpg)

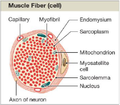


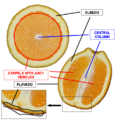


.png/120px-Ovipositor_(PSF).png)


.png/120px-Pedicel_(PSF).png)
.png/109px-Perineuronal_nets_-_Before_and_after_disruption_with_chondroitinase_ABC_(ChABC).png)


.png/120px-Petiole_2_(PSF).png)


.png/72px-Plant_seed_(PSF).png)
.png/120px-Potato_Beetle_(PSF).png)


.png/100px-Rooster_1_(PSF).png)


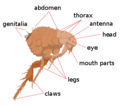


.svg/120px-Simple_diagram_of_animal_cell_(en).svg.png)
.svg/120px-Simple_diagram_of_bacterium_(en).svg.png)
.svg/120px-Simple_diagram_of_plant_cell_(en).svg.png)
.svg/120px-Simple_diagram_of_virus_(en).svg.png)
.svg/120px-Simple_diagram_of_yeast_cell_(en).svg.png)


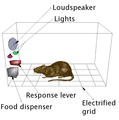

.png/120px-Spadix_(PSF).png)


.png/120px-Stipule_(PSF).png)


.png/98px-Thigh_(PSF).png)

.svg/89px-Tylosaurus_gut_contents_(SDSM_10439).svg.png)


.png/120px-Wattle_2_(PSF).png)